
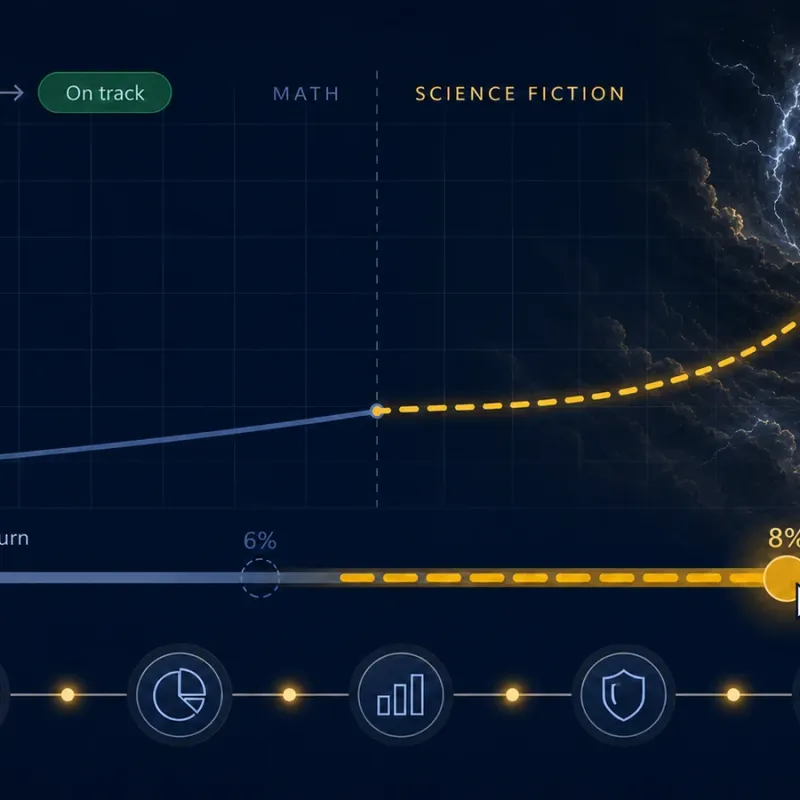
Best Retirement Calculator: Why One Number Is Not Enough
Understand what a retirement calculator should do and use a five-tool framework that turns each answer into your next retirement decision.
16 min read

Key Takeaways:
Ask what a good monthly retirement income for a couple is and you get a range. Roughly 8,500 a month. Google now prints that answer above every article on the page, so you do not even have to click.
Here is where the range comes from. The Social Security Administration puts the average retired-worker check at 4,171.96. Add 4% a year off a few hundred thousand dollars of savings and you land inside the range that every result on page one quotes.
You can’t pay the grocery store with national averages.
I have never handed a couple a national average and called it their answer. The average describes a country. You are running one household, with one set of bills, in one state, with two specific Social Security records. Those numbers exist. They are in your bank account and on your Social Security statement right now, and they will give you a better answer in ten minutes than any survey will.
Almost every page answering this question starts with a replacement rate. Replace 70 to 80% of the income you earn today and you will be comfortable.
I have never seen that hold up.
When you’re at work all day, you’re earning money and not spending it. When you’re retired, you’re at home spending it all day. Your commute stops. Your payroll taxes stop. The money you were putting into your 401(k) stops. Those are real savings, and they are the reason the 70% rule sounds sensible. But they come off your paycheck, and your paycheck is not what you spend.
So the floor is this: you need the same take-home money you are spending right now. Not 70% of your gross salary. The same disposable income, after tax, that leaves your account in a normal month.
That is the floor. Nobody’s average pays your bills. Start with what you spend now, subtract Social Security and your pension, and see what your portfolio has to carry. The first ten years normally run above that floor.
In the first five to ten years of retirement I have watched spending run higher than it did while people were working, and the reason is not complicated. All the travel, the home renovations and the hobbies they put off for thirty years arrive at once.
Everything you wanna do costs money. Golfing costs money. Travel costs money. Home renovations cost money. Driving across the country to see your kids costs money. When you were at work you were earning; now you are at home with time to fill, and filling it has a price.
Plan for a number at or above what you spend today. A plan built on 70% of your salary is short before your first full year is over.
A good monthly retirement income for a couple is whatever covers your bills without draining the portfolio that has to pay them for the rest of your life. Everything you need to work that out is already in front of you.
| Step | What you do | Where the number comes from |
|---|---|---|
| 1 | Add up what you spend in a normal month, take home | Your bank and card statements, not your salary |
| 2 | Add up your guaranteed income, as deposited | Your Social Security statement and pension, after Medicare and tax |
| 3 | Subtract step 2 from step 1 | This is your gap |
| 4 | Multiply the gap by 12, divide by your portfolio | This is your burn rate |
Two things people miss at step 2.
Your Social Security check is not what the statement says. Medicare Part B is deducted before the money reaches your bank. In 2026 that is 405.80 a month for a couple, or $4,869.60 a year. Higher earners pay a surcharge on top, based on income from two years earlier.
The size of your check depends on when you claim. On the Social Security Administration’s own figures, a worker with maximum earnings who retired in January 2026 receives 4,207 at full retirement age of 67, and $5,181 at 70. The claiming decision moves your number more than almost anything else on this page.
Here is a worked example.
| Line | Amount |
|---|---|
| What you spend now, take home | $7,000 a month |
| Two Social Security checks, as deposited | $3,700 a month |
| Your gap | 39,600 a year |
| Your portfolio | $900,000 |
| Your burn rate | 4.4% |
Same couple, same spending, with $650,000 saved instead: the gap has not moved, but the burn rate is 6.1%. Their number did not change. Their answer did.
The gap tells you what your portfolio has to produce. Your burn rate tells you whether it can.
| Your burn rate | What it means for you |
|---|---|
| Below 5% | You have room. Budget the bigger travel, the renovation and the new car, as long as those costs plus your existing living expenses keep you under 5% |
| Above 5% | Budget the travel year by year, against what the market actually gave you |
Above 5%, here is how that works in practice. You take what the market gives you. After a banner year, set some of the gain aside in stable value and treat it as next year’s travel budget. That money is now secure, planned and budgeted for. If the market has a bad year, put some things on hold and keep going. You walk it forward one year at a time instead of committing to a five-year plan you may have to break.
You don’t want to invade your portfolio too much, because then you’re drastically reducing your future standard of living. A dollar you take out early is not one dollar. It is that dollar plus everything it would have earned for the rest of your life. You can get yourself into trouble by not watching your burn rate.
The 4% rule says you can withdraw 4% of your portfolio in the first year, adjust it for inflation each year after, and have a high probability of your money lasting 30 years. It is real research and it is useful.
It is a rule about withdrawing, and it stops there. It says nothing about which account the money leaves, and nothing about the tax you pay on the way out. Two couples with the same balance and the same spending can bank very different amounts of that 4%, purely because of where their money sits. A dollar out of a Roth arrives whole. The same dollar out of an old 401(k) arrives after income tax.
The 30 years is worth a second look too. Run the Social Security 2023 period life table for a couple who both retire at 62, and on average 27 years pass before the second death. But averages hide the risk. That same couple has roughly a 1 in 3 chance that one of them is still alive at 92, which is 30 years in. A period table is a baseline rather than a forecast, and this math treats the two lives as independent, so read it as a planning range. One couple in three needs their money to keep working past the day the rule stops promising anything.
Around the ten year mark the travel tapers off, and something else takes its place.
Some couples move closer to their kids. Some downsize to a smaller house. These are often things that people fail to plan for up front, and they cut both ways. Selling a house and moving somewhere cheaper can hand you a surplus. Moving to be near kids who live in an expensive city does the opposite, and I have seen that happen as often as the good version.
Keep your eyes open and keep testing. This is where a calculator earns its keep: you can test and retest and test again, as your ideas change and as your life unfolds in front of you.
Run your plan with one Social Security check. On the day one spouse dies, the smaller check stops. The survivor keeps the larger one and soon files taxes as Single. See what that does to your monthly gap before you need to live it.
This is the largest single change your household income will ever go through, and almost nothing written about retirement income for couples puts a number on it.
When one spouse dies, Social Security does not add the two benefits together. The survivor keeps the larger check and the smaller one stops. A survivor at their full retirement age receives up to 100% of what the deceased spouse was getting, and nothing more.
The tax side lands the same year. The year of death is the last year you can file jointly. After that, unless there is a dependent child at home, the survivor files as Single. In 2026 that is a standard deduction of 32,200, with brackets half as wide. Less income, taxed harder. Life insurance can cushion the blow. In the couples I have worked with the policy is often long gone by then, because the kids are grown and the house is paid off, so it stopped looking like a cost worth carrying.
You cannot change those rules. You can prepare for them, and the preparation happens while you are both still here.
Look at Roth conversions early. Every dollar you move while you are still in the wider joint brackets is a dollar the survivor never pays a Single rate on. You pay that tax now and the saving arrives years later, so price it before you move. It is worth most when you are confident the survivor will be filing Single on the same income.
Fill the joint tax bracket every year. There is a band of income you can take without moving into the next rate. Leaving it unused is a use-it-or-lose-it decision you make by accident.
Harvest your long term gains and step up your basis. In 2026 a couple filing jointly pays 0% on long term capital gains up to $98,900 of taxable income. Even if you do not need the money, realize gains up to that ceiling, then buy the same security straight back. The wash sale rule applies to losses, not to gains, so there is nothing to wait out. Your cost basis resets higher and the tax bill was zero. Do it again next year with a different part of your portfolio. By the time one spouse is filing alone in a much tighter bracket, they are sitting on holdings with very little embedded gain left to tax.
You can’t get back that money you overpaid to the government because you didn’t sequence your withdrawals properly. That is future income lost forever. Which order you draw from your Roth, your brokerage account and your old 401(k) depends on your own balances and your own bracket. There is no blanket answer, and I know that’s what people are looking for. It’s no different than finding the person you’re gonna marry. It’s that unique and that individualized. Run your numbers, and check them with your tax professional before you act.
Your gap has to come from somewhere every month for the rest of your life. How it’s structured, how it’s invested and how it’s protected is the main engine that drives your retirement income.
The biggest risk in retirement is needing to withdraw income while your portfolio is down. A portfolio can recover. Withdrawals during a major downturn permanently change the math.
Which is why one engine is not enough. A stock and bond portfolio is supposed to give you two, with the bonds cushioning the stocks. That only works when the two move differently. Over the year to 28 August 2026, SPY and AGG had a correlation of +39%, measured on daily returns of their adjusted closing prices. Positive correlation means your bonds are not diversifying your stocks. They are amplifying them on the way down.
A retirement income portfolio should rely on multiple income sources, not just stocks and bonds. I wrote about how to build one in retirement income sources, and you can see what a bad sequence of years would do to yours with the free Portfolio Stress Test.
If your burn rate is above 5%, your portfolio structure is the difference between the plan holding and the plan failing, and Gold+ includes the stage based Refined FI portfolios and the withdrawal sequencing tools built for exactly that job.
Your retirement income is not a national average. It is what you spend, minus what Social Security and your pension actually deposit, and the gap your portfolio has to carry. Run that number with two checks. Then run it again with one. That is the plan you need to protect.
Some couples do and some cannot, and the deciding factor is what you spend rather than what you receive. If your take-home spending today is 6,000 a month, 3,000 monthly gap your portfolio has to fill, which is $36,000 a year.
60,000 a year, which sits near the middle of what most sources report for retired couples. Whether it works for you depends on your housing costs, your health costs and where you live. Add up your own take-home spending for a normal month and compare it to $5,000 directly. That comparison answers the question in about ten minutes.
96,000 a year, which is above most published averages for retired couples. It is comfortable for most households and tight for a couple carrying a mortgage in a high cost area while funding significant travel. Your spending decides, not the national figure.
Two average Social Security checks came to 5,000 and $8,500 a month once savings, pensions and other income are counted. Treat those as a description of other people rather than a target for you.
36,000 a year. At a 4% withdrawal rate that needs 720,000. Divide your annual gap by the rate you are comfortable withdrawing, and you have the portfolio size your plan depends on.
Understand what a retirement calculator should do and use a five-tool framework that turns each answer into your next retirement decision.
16 min read

BlackRock's BDVIX owns thousands of bonds, but retirement income diversification requires more than one income engine.
8 min read
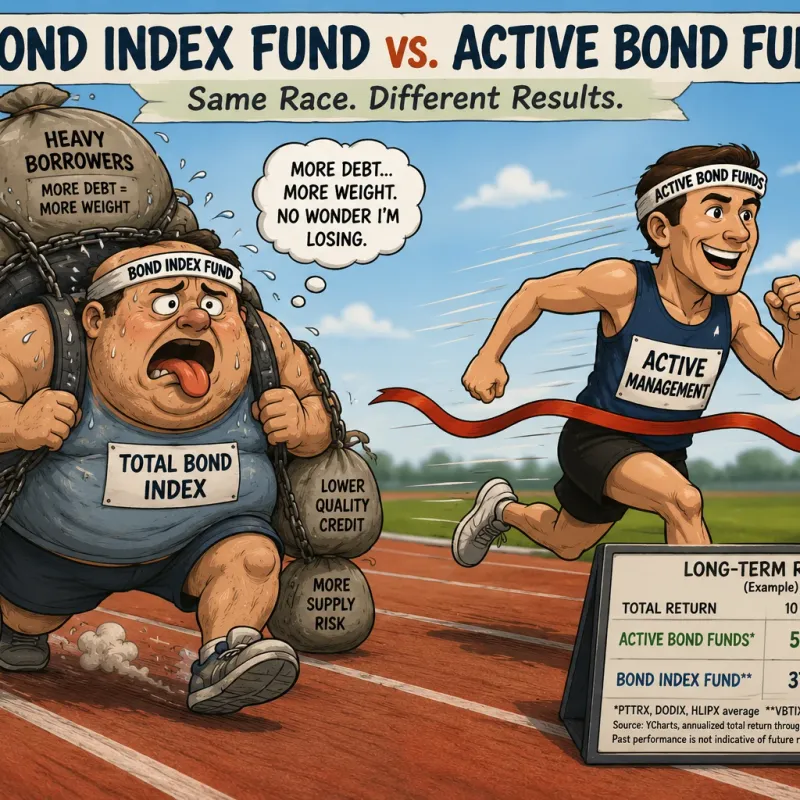
The best bond funds for retirement are usually active, flexible funds, not debt-weighted indexes. Refined FI weighs inflation and stock-bond correlation first.
11 min read