Dead Weight: Zombies in Your Portfolio
If your portfolio holds small-cap funds, you're carrying dead weight into retirement. The market has changed.
6 min read

Key Takeaways:
Most investor portfolios assume the future will resemble the recent past. Stocks compound. Bonds cushion the downside. Inflation stays manageable.
Sometimes that’s true. In 2022, none of it was.
The 2022 bond crash exposed a hidden problem: many investors owned bond funds without understanding the bond fund risks retirees should understand inside the index.
Harry Browne saw this coming decades earlier. His response was radical for its simplicity: instead of forecasting which economic environment would arrive next, own assets designed to survive all of them.
The result became one of the most durable portfolio frameworks ever published, and one of the most misunderstood.
The Permanent Portfolio splits a portfolio equally across four assets, each assigned to one economic regime:
That’s the entire framework. No forecasting. No tactical trading. No market timing. Four assets doing four different jobs.
Browne’s claim was that different assets would protect the portfolio in different environments. The 21st century has tested that claim repeatedly.
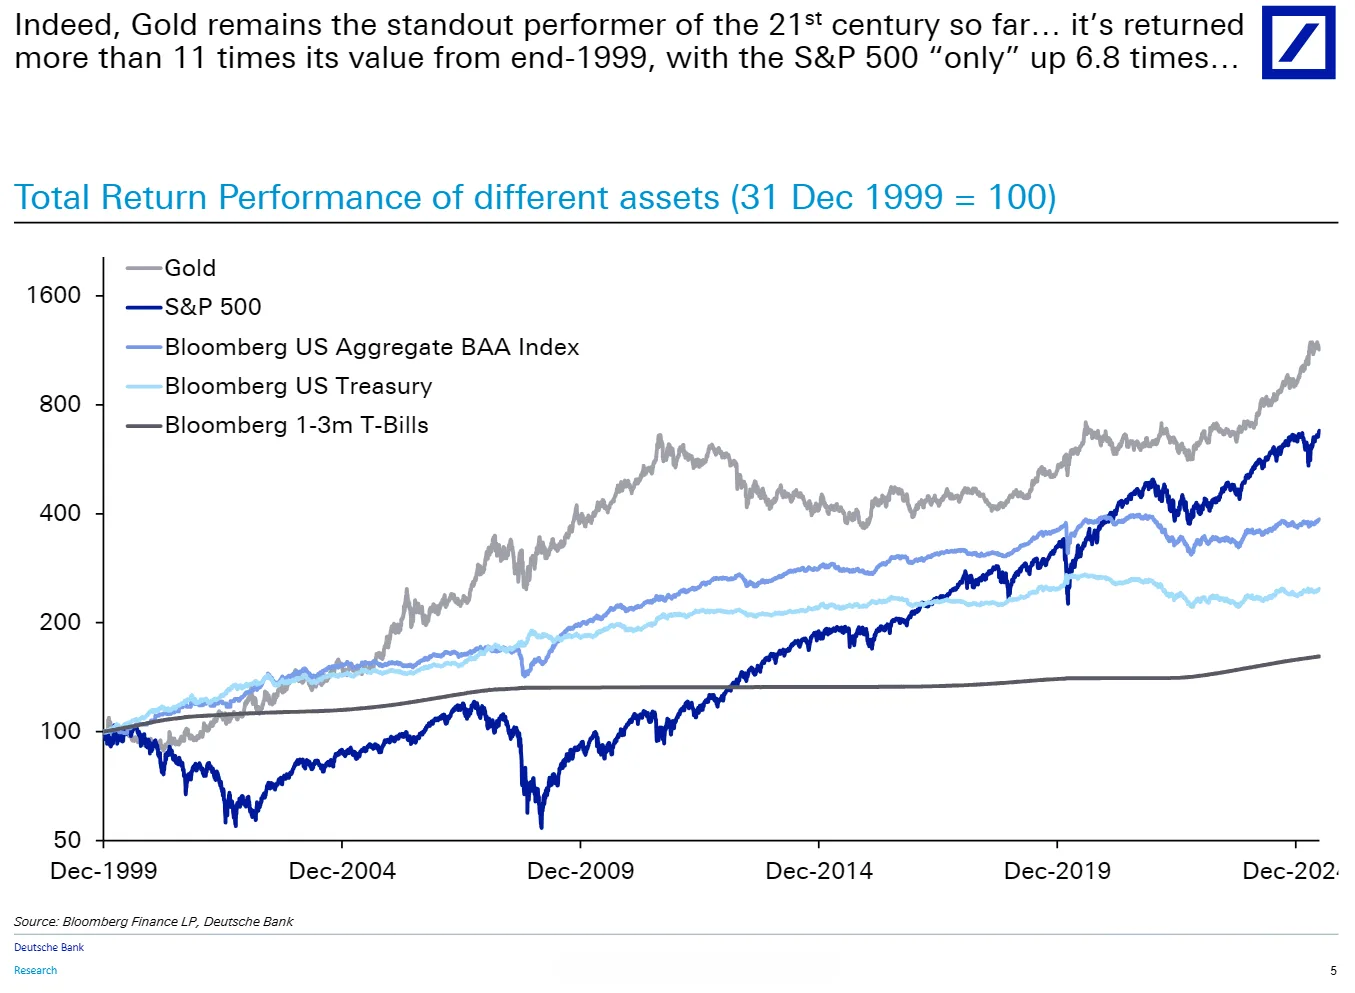
The chart above tells a story most investors haven’t internalized. Gold, the asset many retail investors dismiss as a “doomsday” allocation, has been the best-performing major asset class of the 21st century. Not stocks. Not bonds. Gold.
That’s not an argument for going all-in on gold. It’s an argument that the assets most investors aren’t holding are often the ones doing the most work during regime shifts.
The numbers get more interesting when you look at what gold actually does during equity drawdowns.
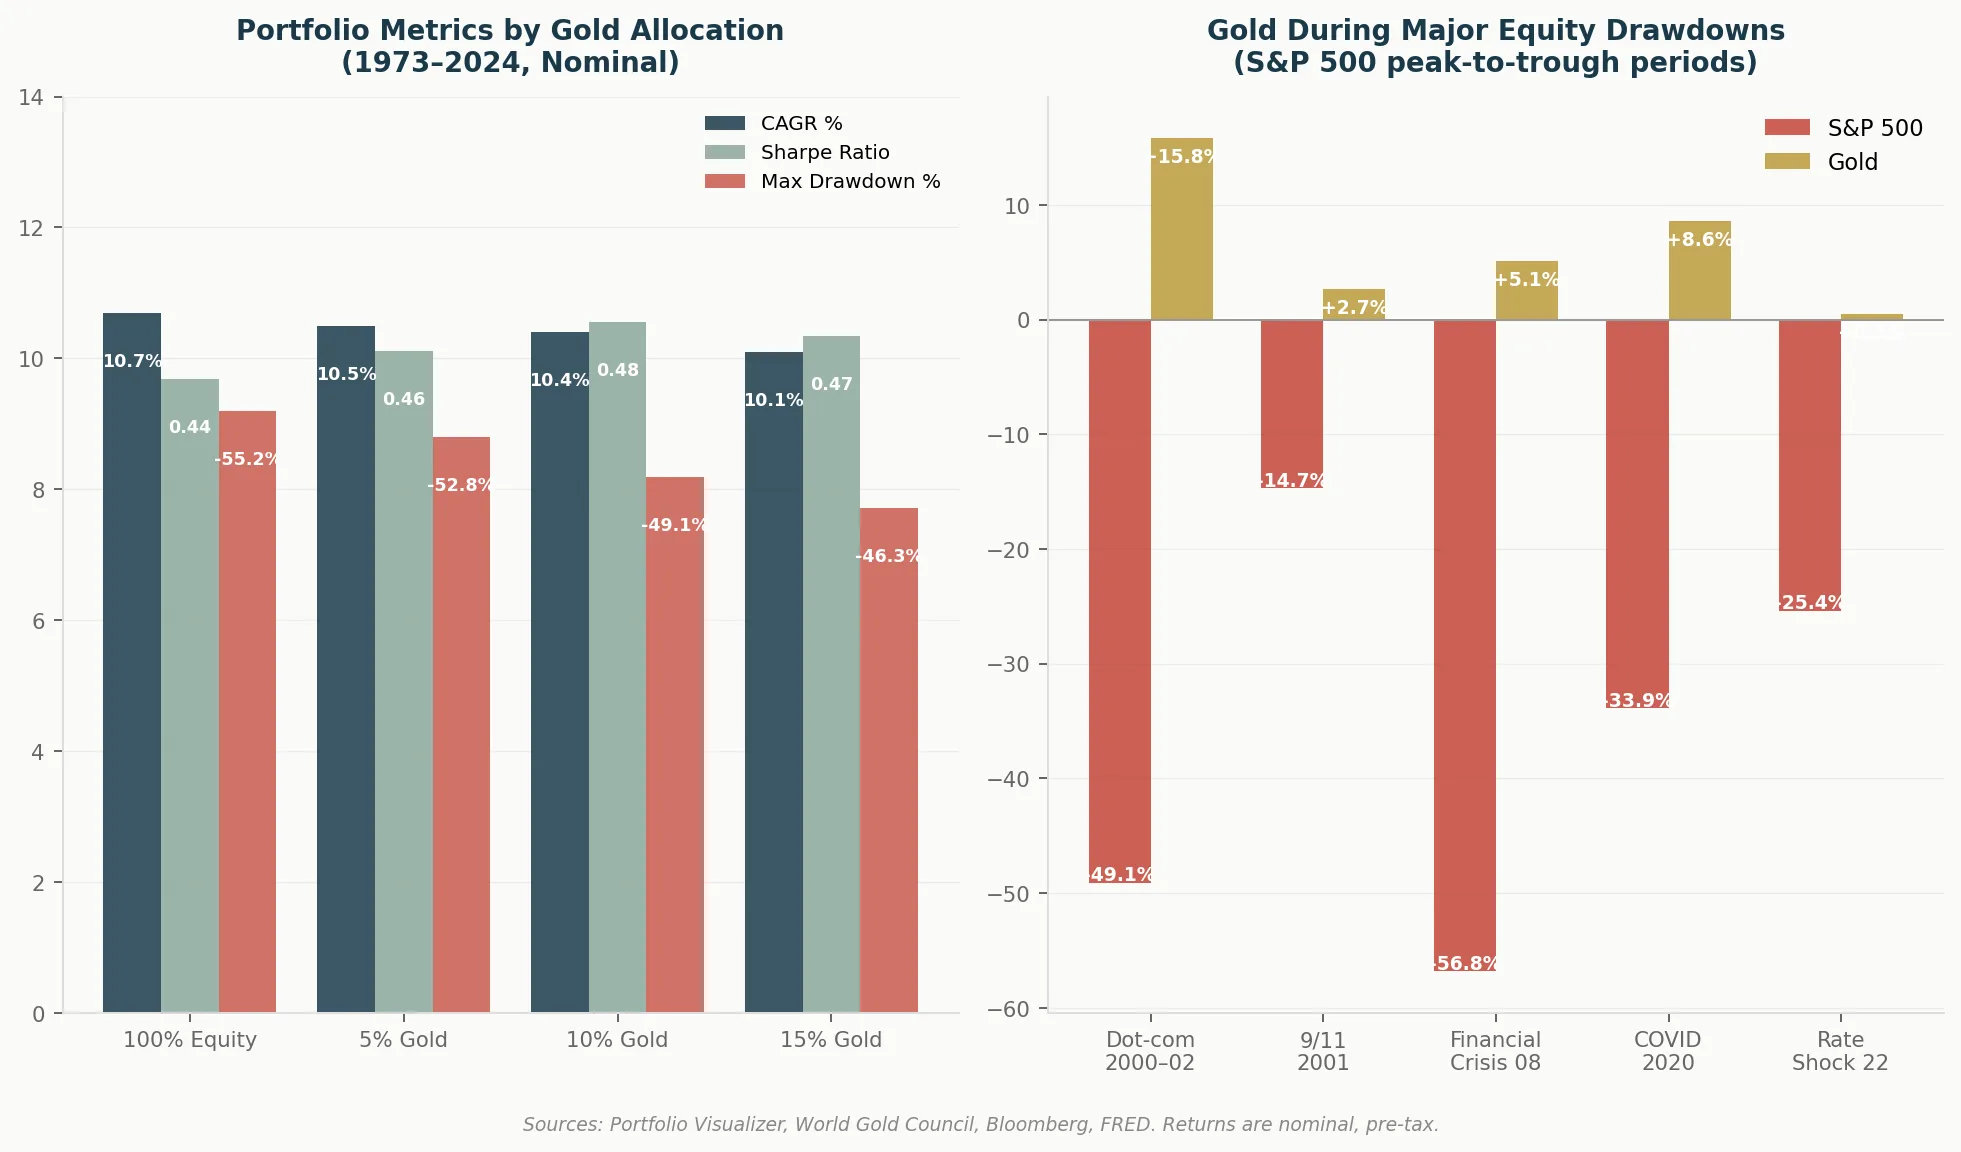
The left panel shows what a small gold allocation does to a 100% equity portfolio over 50 years. A 10% gold sleeve drops max drawdown from 55% to 49%, and barely touches the Compounded Annual Growth Rate (CAGR).
The right panel is even more striking. In five of the worst S&P 500 drawdowns of the past 25 years, gold was positive in all of them. During the dot-com crash, gold returned +15.8% while the S&P fell 49%. During the 2020 COVID drawdown, gold gained 8.6% while the S&P fell 34%.
That is not coincidence. That is functional diversification.
The original 25/25/25/25 allocation has a problem the historical backtests obscure: it sacrifices too much upside.
A traditional 60/40 portfolio historically supported a 4% withdrawal rate. The Permanent Portfolio, with its 6.7% historical annual return versus 11.8% for the S&P 500, likely can only support income distributions closer to 3% to 3.5% of the portfolio.
That means a retiree wanting $80,000 in annual income needs $2 million in a 60/40, or $2.3 to $2.7 million in a Permanent Portfolio. That’s a meaningful gap.
Retirees need to ask: “Which portfolio can support income through up and down markets?” A static allocation surviving every environment is not realistic. That is the problem the retirement income portfolio was built to solve.
There’s another problem worth naming. Gold’s historical track record looks cleaner than it actually is. From 1933 to 1974, private gold ownership was restricted in the U.S. and prices were fixed for long stretches. A fixed price produces artificially low volatility. Much of the Permanent Portfolio’s legendary stability comes from simulations that lean on those decades.
This doesn’t invalidate the framework. But anyone claiming the portfolio “proved itself” through every historical crisis is not being honest with all the facts.
I wouldn’t invest in a Permanent Portfolio. Twenty-five percent cash is too much drag for most investors, and the upside trade-off is steeper than most people realize when they see the headline drawdown numbers.
But the framework is essential.
Most portfolios are just different tickers disguised as diversification. The truth is, they are one economic bet wearing different costumes. When stocks and bonds are correlated, as they are today, both fall when rates rise sharply. Dividend stocks and corporate bonds both struggle in a credit crunch. “Diversified” is not the same as it was in past market regimes.
Browne’s real insight wasn’t the 25% allocation. It was the question every retiree or near-retiree should ask: Does my portfolio only work if the future behaves the way I expect?
If the answer is yes, or worse, if you’ve never asked, you don’t have a diversification problem. You have a structural one.
That’s the lesson worth keeping. The exact allocation is yours to decide.
Nobody is watching whether your portfolio still fits the market regime.
Gold+ is your retirement navigation system: find your number, follow the portfolio built for your stage, and get a specific action when market risk changes.
This article is for educational and informational purposes only and does not constitute investment advice. If this article discusses any security, the discussion is for educational purposes only and should not be interpreted as a recommendation, solicitation, or personalized advice. The author may have holdings in the securities discussed. Refined FI is NOT a registered investment advisor. Past performance is not indicative of future results. All investing involves risk, including possible loss of principal. Historical figures are based on long-term market data and subject to assumptions and limitations. Chart on gold and S&P 500 21st-century performance sourced from Deutsche Bank Research / Bloomberg Finance LP. Portfolio metrics by gold allocation sourced from Portfolio Visualizer, World Gold Council, Bloomberg, and FRED. Refined FI receives $0 in affiliate revenue, commissions, or compensation from any fund company or financial institution mentioned in this article.
If your portfolio holds small-cap funds, you're carrying dead weight into retirement. The market has changed.
6 min read
The Permanent Portfolio got the framework right: assets need jobs. But one fixed 25/25/25/25 allocation may not solve retirement.
7 min read