
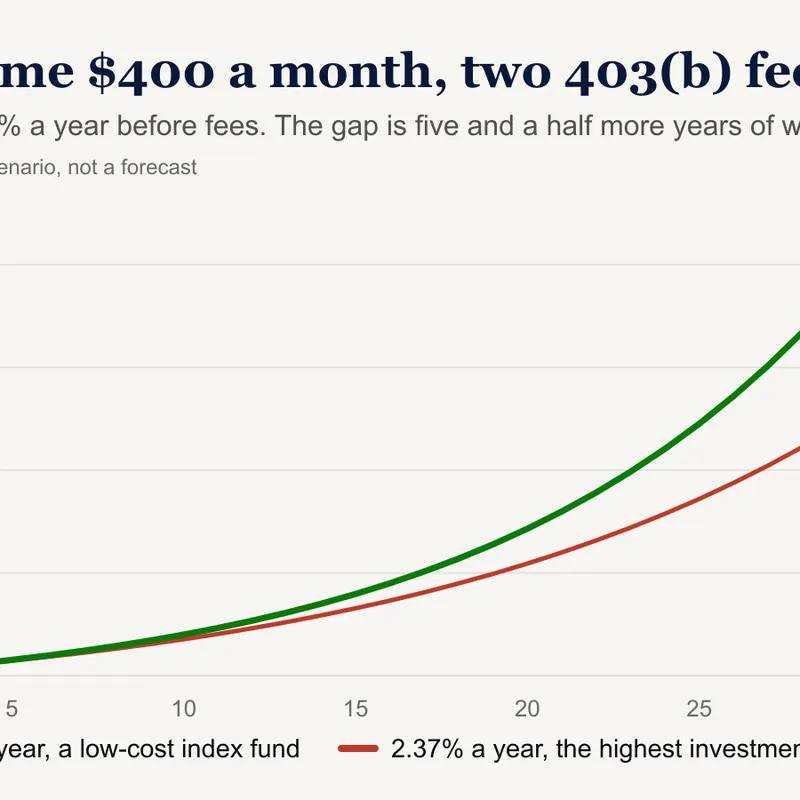
403(b) Retirement Plan: How One Fee Can Add 5½ Years of Additional Work
I used to sell 403(b) annuities to teachers, but not anymore. What I learned to do and what NOT to do could save you years off your retirement date.
20 min read

If you’re searching for how to protect your 401(k) from a market crash before one arrives, you’re asking at the right time. Waiting until the market is falling is like being in a burning building and only then looking for the exits. The planning that protects a 401(k) happens before the fire.
Real protection, knowing when to step out of the market and when to step back in, is a skill. It took me a career to build, and most people, professionals included, never get it. You still have plenty you can do on your own, and every piece of it below is tested on real data.
Your 401(k) falls with whatever it holds, and the loss only becomes permanent if you sell or pull money out near the bottom. Start with the percentages. Here is what the S&P 500 did in the four bear markets since 2000, measured from its highest close to its lowest close:
| Crash | S&P 500 fall | Back to its old closing high |
|---|---|---|
| Dot-com, March 2000 to October 2002 | 49.1% | 7 years 2 months |
| Financial crisis, October 2007 to March 2009 | 56.8% | 5 years 6 months |
| Pandemic, February to March 2020 | 33.9% | 6 months |
| Inflation, January to October 2022 | 25.4% | 2 years 1 month |
A percentage tells you how big the fall was. Years tell you the true cost. So I built an example family and walked them through all four crashes.
In January 2000 they have $100,000 in an S&P 500 index fund inside their 401(k). They earn $100,000 a year, get a 3% raise every January, and put 10% of every paycheck in. They never stop, never sell, and never move a dollar. Then I measured each crash in the unit that matters to them: years of saving.
| Crash | Your 401(k) at the top | What the crash took | Years of saving erased |
|---|---|---|---|
| 2000 to 2002 | $107,051 | $59,609 | 5 years 7 months |
| 2007 to 2009 | $242,849 | $141,329 | 10 years 10 months |
| 2020 | $1,106,722 | $374,572 | 20 years 9 months |
| 2022 | $1,657,817 | $409,274 | 21 years 4 months |
Look at the last two rows. The 2022 drop was less than half the size of 2008’s, and it erased twice the years. The difference is the balance. By 2022 the family had almost seven times as much money at stake as in 2008, and every percentage point of it was worth more years of paychecks.
The same crash costs you more years the closer you get to retirement, because your balance grows far faster than your paycheck.
The 2020 row deserves an honest note. Almost 21 years of saving disappeared in five weeks, and all of it was back within six months. The family came out whole because they held on and didn’t need the money. A crash turns into a real loss when you sell into it or have to withdraw from it. At 35 you have neither problem. A few years from living on this money, you may have both.
I started my career in the middle of the dot-com bust, and over the years I met a lot of people who pulled money out of the stock market at the absolute worst time. This article is for the person who wants a plan in place before that moment arrives.
There’s a quieter kind of panic than selling: turning your contributions off until things calm down. It feels careful, so I tested it.
I gave the family a twin. Same salary, same raises, same fund, same $100,000 start. The twin follows one rule: when the S&P 500 closes down 20% from its high, they get scared and stop contributing, and they start again only once the market closes at a new all-time high. The twin stopped four times:
That’s 11 years and 7 months with retirement saving switched off, and $154,014 in paychecks that never went into the account.
| Kept contributing | Stopped at a 20% drop | |
|---|---|---|
| Put in, including the $100,000 start | $500,872 | $346,858 |
| Your 401(k) today | $3,000,340 | $1,768,158 |
The family that kept contributing had $1,768,158 back in January 2024. Same target, same family, 2 years 8 months less work.
Most of that gap comes from the paychecks that never went in. Money you don’t send to your 401(k) lands in your checking account, and checking accounts get spent. The twin’s real bill is bigger than the table, too. Every month they stopped, they gave up their employer’s match and paid state and federal income tax on pay that would have gone in before tax. In theory the twin could have parked those paychecks in cash and invested them all at the restart. Panic under pressure doesn’t work that way, and the next story is what it looks like in real life.
In October 2008 I met a couple who had just pulled their money out of the stock market. The S&P 500 fund fell another 29% after they sold, to the bottom in March 2009. Then it turned, and ripped higher. I ran into them again in 2015. They were still in cash. By the end of 2015 the market was up 145% from where they got out. Over those seven years, cash in a short-term Treasury fund earned about 10.7% in total. They never became clients. Every time the market reached a new high, they said the same thing: it’s at a new high, I can’t invest now. They are probably still working today.
If you think you can’t invest at all-time highs, your thinking is backwards. J.P. Morgan looked at every trading day from 1988 to 2020. Money put into the S&P 500 on any day made money over the next year 83% of the time, and averaged 11.7%. Money put in on a day the market closed at a record high made money 88% of the time, and averaged 14.6%. Since 1950, almost a third of all record highs became a floor the market never fell below again.
Keep every paycheck going into your 401(k) through the drawdown, and keep investing at new highs. Stopping cost the twin 2 years 8 months, before counting the match they gave up. Don’t put off your retirement waiting for a better price.
Every article on protecting your 401(k) tells you to diversify. Here is the definition I work from: diversification means owning things that move independently of each other. When one falls, the other has no reason to fall with it.
Only one direction matters. You don’t care when two things rise together. You only care when they fall together, because that’s the month your whole 401(k) goes down at once.
Researchers Claude Erb and Campbell Harvey sorted every month from 1975 to 2012 by what stocks and gold did:
| What happened that month | Share of months |
|---|---|
| Both rose | 31% |
| Stocks rose, gold fell | 32% |
| Stocks fell, gold rose | 20% |
| Both fell | 17% |
Vanguard found much the same for stocks and high-quality bonds: since 1976, both lost money in nearly 15% of months. Over the long run, that’s what diversification looks like. The second asset still has bad months, and falling together happened in about one month out of six.
Now the part that matters today. I ran the same count on the months your stocks fell, from January 2005 to August 2026:
| When stocks fell, the other fell too | 2005 to 2019 | 2020 to 2026 |
|---|---|---|
| Bonds | 41% | 75% |
| Gold | 45% | 64% |
Since 2020, bonds fell right along with stocks in three out of every four down months. When inflation runs high, stocks and bonds tend to move together, and your diversifiers become your amplifiers. This is nothing new. A 2023 study by AQR found stocks and bonds moved together through the 1970s, 80s and 90s, when inflation was uncertain, and moved in opposite directions for the first twenty years of this century.
In 2021 I took this research and my analysis to an investment committee. I hadn’t been on that team long, and they hadn’t yet seen my quantitative background in action. Their first answer was the one you’ve probably heard: stocks and bonds are different asset classes, so they diversify. My answer was that they’re different asset classes, and depending on how they’re moving, they either act as one asset class or they diversify you. The data going back to the 1970s is what swayed them.
When everything you own moves together, you have one big bet on the table. A holding that’s there to protect you and falls with your stocks is failing its one job. A holding that isn’t there to protect you has earned less than stocks would have. Either way, your money is working below its best. Gold held forever as your safe asset is the same mistake in a different costume, and since 2020 it fell in almost two of every three months your stocks fell.
Sometimes you look around and nothing is diversifying you. That’s when you go to stable value or cash. A money market fund might only pay a fraction of what you’d like, depending on where rates are, and it doesn’t go down when the market goes down. That’s what you want from the protective part of your 401(k): something that holds its value when stocks fall, so you can rebalance from it.
Diversification is measured when your stocks fall. If other assets you own fall with them, you have one big bet on the table, and the protective part of your 401(k) belongs in stable value or cash until that changes.
When stocks and bonds move in opposite directions, your portfolio behaves like a seesaw. Your stocks go down, your bonds go up, and the ride stays level. When they move together, it’s a trampoline. Two people on the same mat: when one lands, the other sinks with them, and the drop gets bigger. That’s what you get when your diversifiers become your amplifiers.
I track which environment you’re in by measuring how closely stocks and bonds have moved together over the past 12 months, as a percentage. Below zero is the seesaw. Above zero is the trampoline. You can check today’s reading yourself on Stock Market Warning Signs, updated every market day.
In February 2020 that reading sat around minus 35%. Bonds were doing their job. On March 12, 2020, in the middle of the pandemic crash, it crossed above zero. Apart from a few brief dips in 2021 and 2022, it has stayed there, and it has been above zero every single day since May 27, 2022. On September 22, 2026 it read 41%, the highest since 2005.
The damage followed. Here is what three bond funds did from their high in August 2020, with the interest they paid counted:
| Bond fund | Worst fall | Still below that high today |
|---|---|---|
| Long-term Treasuries, 20 years and up | 48.3% | 42.3% |
| Treasuries maturing in 7 to 10 years | 23.9% | 13.1% |
| Total bond market | 18.4% | 3.4% |
A long-term Treasury fund bought at its 2020 high is still down 42% six years later, interest included. That’s the fund most people think of as the safe part of a portfolio.
In mid-2021 I moved the portfolios I managed out of long-term bonds. It took longer than I wanted, because a change like that goes through an investment committee, and I had to show them the data first.
It’s still happening. From February 27 to September 22, 2026, long-term Treasuries fell another 7.6%, the 7 to 10 year fund 4.8%, and the total bond market 2.8%, while stocks and bonds kept moving together.
Bonds protect your stocks only while the two move in opposite directions. Since March 2020 they have mostly moved together, and the longer the bond, the deeper the hole.
Diversifying always costs you something. Every dollar in the protective part of your 401(k) is a dollar out of stocks, and over long stretches stocks earn the most beyond inflation. So before you add anything to your portfolio, ask what you’re giving up, and whether that trade is worth it for the current environment we are in right now.
I priced it. Give the family the 30% for all 26 years instead of only near the end, with the short-term Treasury fund standing in for stable value. Today they’d have $2,025,350 instead of $3,000,340. That’s $974,990 less, and the all-stock family reached $2,025,350 back in June 2024. The wrong portfolio that was too conservative made them work an additional 2 years 3 months.
| Where you are | Your portfolio’s job | What your 401(k) should hold |
|---|---|---|
| More than ten years from retirement, saving | Grow as fast as possible | A low-cost S&P 500 index fund |
| Inside ten years of retirement | Keep growing, and protect what you’ve built | 70% low-cost S&P 500 index fund, 30% in protection |
Once you retire, the job changes again, to paying you, and I cover that below.
I hear this one a lot: “I’m 20 years from retirement and I’m in a target-date fund, so I’m diversified.” A target-date fund spreads your money across US stocks, international stocks and high yield bonds, and at 20 years out most of those assets do more harm than good.
It’s a Las Vegas buffet. Choose one of everything and you won’t go hungry, you’ll go slow. The full cost, in years, is in Target-Date Fund vs S&P 500.
Your stage sets your allocation. The macro environment sets what fills the 30%. Right now, with inflation elevated and stocks and bonds moving together, that’s a stable value fund. When inflation is clearly falling, an actively managed bond fund can take its place. The 30% stays either way, because it comes from how close you are to the finish line.
When do you switch? Once you are ten years from retirement, make the change at your next yearly rebalance, in one move. Ten years isn’t a magic line in the sand, and waiting a little is fine. Your retirement is just over the horizon now. Before, it was far enough away that you couldn’t see it. Now is the time to start protecting the downside risk, because a bad stretch this close to the date can undo years of progress. The full stage-by-stage breakdown is in Your 401(k) Portfolio: One Job, One Fund, and Where the Rest Belongs.
Every fund in your 401(k) needs a job, and your stage decides it. More than ten years out, own growth. Inside ten years, move the 30% in one step, and let today’s conditions decide what fills it.
The rule people cite most for protecting a portfolio is the 200-day moving average. Average the last 200 daily closing prices of your stock fund. At the end of each month, if the fund closes below that average, move to stable value. When it closes back above at a month end, move back in. Its cousin, the golden cross, where the 50-day average crosses the 200-day, has the same problem you’re about to see.
I tested it on the family. Same money, same paychecks, same 26 years.
| Held through everything | Followed the rule | |
|---|---|---|
| Worst fall | 50.8% | 26.3% |
| 2007 to 2009, on the money at the top | Down 55.3% | Up 0.4% |
| Your 401(k) today | $3,000,340 | $2,747,070 |
On paper that’s a good trade. It cut the worst fall in half, sat out 2008, and finished only 5 months behind.
Now live with it. The rule said sell 18 times, and 14 of those were false alarms: it sold, the market kept climbing, and it bought back in higher. From 2010 to 2022 it was wrong 9 times in a row. That’s twelve years of selling, watching everyone else make money, and buying back at a worse price. And that’s the gentle version. Checked every day instead of once a month, it said sell 85 times, and 75 were false alarms.
Then I tested quitting. Two people used the rule, and both quit after five false alarms in a row:
Same rule, same quitting point, opposite outcomes. Every sell signal is a roll of a 20-sided die with about four winning faces: 4 of the family’s 18 signals paid off, and 4 of the retiree’s 27. You roll loser after loser, and the day you finally stop trusting it can land just before the roll that would have saved you, or just after. Nobody knows which in advance, and a plan that only works if you guess right about when to abandon it isn’t a plan.
What matters is whether a person can hold the rule through the false alarms, so it’s still in charge on the day it counts. I know what that takes. In 2008 I was managing about $100 million. My model told me to protect those portfolios in the spring, and they sat in a lot of cash that year and ended it down 2.18% after fees. Every violent rally in 2008 and early 2009 looked like the bottom, and every one went lower. The only reason I held the position was that I had built the model, tested it, and trusted the research behind it. A rule you pick up the week the market falls has none of that behind it.
The 200-day moving average cuts the worst falls on paper, and it cries wolf far more often than it saves you. A rule you can’t follow with twelve years of false alarms won’t be trusted on the day it matters.
Inside ten years to retirement, you need to start protecting your portfolio from downside risks. Put 30% of your 401(k) into a stable value fund. Set both your current balance and your future contributions the same way.
A stable value fund holds its price and pays interest. When rates rise, the interest it pays rises with them over time. It doesn’t fall when stocks fall, and it doesn’t fall when bonds fall, which is exactly the job the protective part of your 401(k) has right now. On your plan’s menu it’s called a stable value fund. If your plan doesn’t have one, a government money market fund does the same job. A bond index fund doesn’t, for the reasons in the last two sections.
Here is what the 30% was worth to the family, on the same balance at the top of each crash:
| Crash | All in stocks, years of saving lost | With the 30%, years of saving lost | The 30% saved you |
|---|---|---|---|
| 2000 to 2002 | 5 years 7 months | 3 years 1 month | 2 years 6 months |
| 2007 to 2009 | 10 years 10 months | 7 years 0 months | 3 years 10 months |
| 2020 | 20 years 9 months | 14 years 2 months | 6 years 7 months |
| 2022 | 21 years 4 months | 16 years 4 months | 5 years 0 months |
The 2022 row undersells it. The short-term Treasury fund standing in for stable value dipped a little that year, and a real stable value fund wouldn’t have. Close to retirement, the goal is to shrink how much you’d have to make back. You give up a little growth to get it, and that’s the trade you want when you’re this close to the finish line.
Three rules to know before the day you need them:
Already retired? Measure a crash in years of spending instead of years of saving. On a $1,000,000 portfolio paying you $40,000 a year, a 2022-sized drop of 25.4% takes 6 years 4 months of spending, and a 2008-sized drop of 56.8% takes 14 years 2 months. You need a plan for protecting your portfolio, written before the fall, and a portfolio built to pay you through it, kept current as the market evolves.
Inside ten years of retirement, hold 70% in a low-cost S&P 500 index fund and 30% in stable value. Rebalance once a year at the end of September, learn your plan’s transfer rules now, and never cash out in a crash.
Protecting a portfolio from a crash is a skill, and it took me a career to develop it. Most professionals work their whole career and never figure it out.
A CPA I worked with told me about a stock he bought in 1997: $10,000 of Yahoo. Life got busy and he forgot about it. By the time he looked, around the January 2000 peak, it was worth about $1.4 million. Then it dipped, and he made himself a promise: as soon as it gets back up there, I’m selling. It never got back up there. Yahoo fell 96.6% from its peak, and he finally sold for about $50,000.
He didn’t have an exit strategy defined upfront. And it cost him years he could have spent retired.
Five times his money sounds fine until you price the alternative. If he had sold at the top and put the $1.4 million in an S&P 500 index fund, it would be worth about $11.8 million today. The $50,000 he walked away with, invested the same way, would be about $597,000. Greed and the fear of missing out kept him in. When it’s your own money, you’re your own worst enemy.
Each one of us has unique skills, but only in specific domains. I’m not a surgeon, and I wouldn’t operate on myself. Market risk is a subject I know. In all my years of people showing me their portfolios, clients and friends, I never once looked at a portfolio and thought, that’s exactly what I would have built. The gap is knowledge. You don’t know what you don’t know. And that’s okay.
I’ve run thousands of tests on real data over the years. When I read a new study, the first thing I do is test it. Was it done properly? Can I replicate it? Most of the time, I can’t. That’s why the 200-day moving average above is tested instead of regurgitated. In my experience, most financial advisors have never run a single backtest. They pass along something they read, as if it was fact, and it could be right or wrong.
From here you have two ways forward:
That’s what more than two decades of research provide. You get the tools, the tested portfolios and someone watching the weather, without first having to learn how to run a proper backtest. Do it yourself. Not by yourself.
You can build this discipline yourself, and it takes a career. Or you can watch the weather on the free Stock Market Warning Signs page, and let someone who has tested every rule keep you in the plan when your own instincts won’t.
It falls with whatever it holds. The S&P 500 fell 56.8% from its 2007 high to its 2009 low and 25.4% in 2022, closing high to closing low. The loss becomes permanent only if you sell or withdraw near the bottom. For a family saving 10% of a growing paycheck, the 2022 drop erased 21 years 4 months of saving on paper, because their balance was far bigger than in 2008.
No. A family that stopped every time stocks fell 20%, and restarted only at a new high, went 11 years 7 months without saving since 2000 and reached today’s balance 2 years 8 months later than the family that kept going. That’s before counting the employer match they gave up and the income tax on pay they didn’t defer.
Not all of it, and not on a feeling. Inside ten years of retirement, 30% belongs in stable value already, set at your yearly rebalance before anything falls. Moving the rest to cash is a sell rule, and a sell rule needs a tested rule for getting back in, or you sit in cash through the recovery.
History says the opposite. From 1988 to 2020, money put into the S&P 500 on a record-high day made money over the next year 88% of the time and averaged 14.6%, against 83% and 11.7% for any day.
On paper, yes. Since 2000 it cut the family’s worst fall from 50.8% to 26.3%. In practice, 14 of its 18 sell signals were false alarms, including 9 in a row from 2010 to 2022, and most people quit a rule long before it pays.
Only while the two move in opposite directions. Since March 2020 they have mostly moved together, and since 2020, bonds fell in 75% of the months your stocks fell. A long-term Treasury fund bought at its August 2020 high is still down 42%, interest included.
Measure a crash in years of spending. On $1,000,000 paying you $40,000 a year, a 2008-sized drop takes 14 years 2 months of spending. You need a plan for not panicking, written before the fall, and a portfolio built to pay you through it.
This article is for educational and informational purposes only and does not constitute investment, financial, tax, or legal advice. Refined FI is not a registered investment advisor. Past performance does not guarantee future results. All investing involves risk, including possible loss of principal. The family and retiree results are Refined FI’s own historical tests on Vanguard 500 Index, Vanguard Short-Term Treasury and 3-month Treasury bills, using daily closing prices with dividends reinvested and a 0.05% cost per switch; they are one historical path, not a probability, and deduct no tax. The short-term Treasury fund stands in for a stable value fund, which a 401(k) holds at a stable price. Plan rules, fund names and transfer rules differ by plan; verify your own plan documents. Refined FI receives $0 in compensation from any fund company mentioned.
I used to sell 403(b) annuities to teachers, but not anymore. What I learned to do and what NOT to do could save you years off your retirement date.
20 min read
Two people can save the same money and end up with the same portfolio balance. One retires at 52. One has to wait until 59½. The only difference is which account the money went into.
23 min read
Understand what a retirement calculator should do and use a five-tool framework that turns each answer into your next retirement decision.
16 min read